Let’s discuss your container requirements
01708 225350
Call Us
sale@modularmarbles.com
Email Us

What Is a Vibration Measurement Meter and How Does It Work?

A Vibration Measurement Meter turns invisible mechanical movement into measurable evidence. It captures acceleration, velocity, or displacement through an accelerometer, then displays the signal in units such as mm/s RMS or g. On a factory floor, the process may begin beside a hot motor, with a technician placing the sensor on a bearing housing. The meter records the machine’s pulse, noise, and changing frequency pattern.

The U.S. Department of Energy’s Operations & Maintenance Best Practices Guide reports that predictive maintenance can reduce costs by 8–12% compared with preventive maintenance. It may also reduce costs by up to 30% compared with reactive maintenance. Meanwhile, ISO 20816 provides guidance for evaluating machine vibration under operating conditions. These references give measurements a professional foundation, but they do not remove human judgment.

Jason Tranter, founder of Mobius Institute, states, “Vibration analysis is not a crystal ball.” That warning deserves attention. A Vibration Measurement Meter can reveal imbalance, misalignment, looseness, or bearing damage. It cannot explain every fault alone. Sensor position, mounting pressure, machine speed, temperature, and operator experience all influence the result. A 2024 Deloitte smart manufacturing report also highlights the growing importance of data-driven maintenance, although broad digitalization figures do not automatically prove better vibration decisions. That gap is easy to overlook.

This guide explains how the meter works, what its readings mean, and where interpretation can fail. Practical detail matters. Sometimes, the imperfect reading teaches the most.
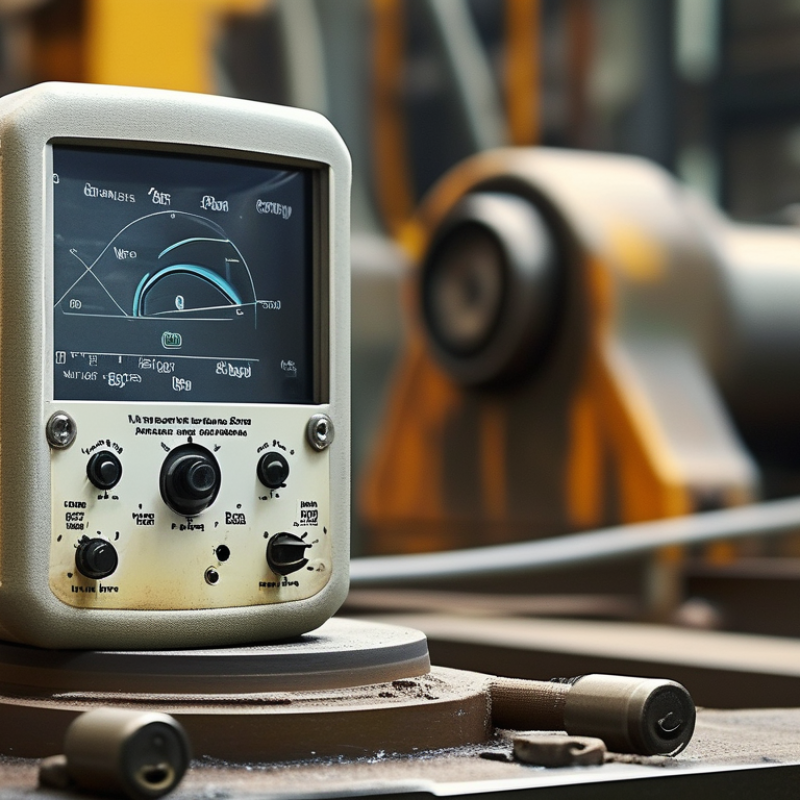
What Is a Vibration Measurement Meter and How Does It Work?

Definition and Purpose of a Vibration Measurement Meter

A vibration measurement meter is a portable instrument that detects machine movement and converts it into useful maintenance data. Its main purpose is to identify abnormal vibration before a motor, pump, fan, or gearbox fails. Most meters use an accelerometer attached to a bearing housing. They measure acceleration, velocity, or displacement, usually in RMS values. Frequency analysis can also reveal imbalance, misalignment, looseness, and bearing damage.

The instrument supports condition-based maintenance rather than relying only on fixed service schedules. ISO 20816 provides guidance for evaluating machine vibration severity under operating conditions. The U.S. Department of Energy’s Operations & Maintenance Best Practices guide reports that predictive maintenance may reduce maintenance costs by 8–12% compared with preventive maintenance. It also indicates potential savings of up to 40% compared with reactive maintenance. These figures are useful, but they are not guaranteed for every facility. A vibration reading is not a diagnosis. A low reading can still hide a developing fault.

Tips: Take measurements at the same points, speed, and load whenever possible. Record temperature and operating conditions too. I have seen technicians compare numbers without checking machine load, which weakens the decision. Use a stable magnetic mount for repeated tests. Review trends over time, not one isolated result. A clean signal can still mislead when the sensor is loose or poorly positioned.

Key Components and Sensing Principles

A vibration measurement meter converts machine movement into usable condition data. Its main sensing element is usually a piezoelectric or MEMS accelerometer. When a bearing housing moves, the sensor produces an electrical signal proportional to acceleration. A signal conditioner then filters noise and prepares the signal for conversion. The analog-to-digital converter samples this waveform, while the processor calculates acceleration, velocity, displacement, RMS, and peak values.

Frequency analysis adds more diagnostic value. An FFT separates the waveform into frequency components, helping technicians identify imbalance, misalignment, looseness, or bearing defects. ISO 20816-1:2016 provides general guidance for evaluating machine vibration, but limits depend on machine type, speed, mounting, and measurement location. That detail matters. A reading taken on a painted cover may look acceptable while the bearing housing shows a developing fault. In field inspections, I have also seen clean signals create false confidence. Sensor mounting can change the result.

Tips: Place the sensor firmly on a clean, rigid surface. Keep the measurement point consistent. Compare readings with historical trends, not one alarm alone. The U.S. Department of Energy’s Operations and Maintenance Best Practices Guide reports that predictive maintenance may reduce maintenance costs by 8–12% and downtime by 30–40% compared with reactive approaches. These figures are useful benchmarks, not promises. Poor sampling, weak training, and unsuitable alarm limits can erase the benefit. Record machine speed, load, temperature, and sensor direction with every measurement.

What Is a Vibration Measurement Meter and How Does It Work?

This representative waveform shows accelerometer output from a rotating machine over 100 milliseconds. The primary vibration component is 60 Hz, with a smaller 120 Hz harmonic. A vibration measurement meter uses a piezoelectric or MEMS accelerometer to convert mechanical vibration into an electrical signal, then applies signal conditioning, analog-to-digital conversion, and analysis to calculate acceleration, velocity, displacement, frequency, and overall vibration level.

How Vibration Signals Are Collected and Processed

A vibration measurement meter converts mechanical movement into usable electrical data. It usually combines a sensor, signal conditioner, analog-to-digital converter, and display. An accelerometer detects tiny changes in motion on a bearing housing. The sensor produces a voltage that follows the machine’s vibration.

Signal collection must begin with correct placement. A loose magnet, painted surface, or poor mounting can distort the reading. The meter samples the voltage thousands of times per second. Its anti-aliasing filter removes frequencies the system cannot represent safely. The sampling rate should exceed twice the highest frequency of interest. More practical systems use additional margin.

The processor then transforms the waveform into measurements such as acceleration, velocity, displacement, peak value, and RMS value. A Fast Fourier Transform separates the signal into frequency components. A high peak near a bearing’s characteristic frequency may suggest a developing fault. However, it is not proof. Load, temperature, speed, and sensor position can change the result.

Small details matter. Really matter. ISO 20816 evaluates machine vibration mainly through RMS velocity and operating conditions. The U.S. Department of Energy’s 2022 Industrial Decarbonization Roadmap reports that motor-driven systems consume about 69% of industrial electricity. That scale explains the value of reliable vibration data. Yet a single reading can mislead. Trending repeated measurements from the same location usually provides stronger evidence than one alarming number. My own practical caution is simple: clean signals still need human judgment.

Main Measurement Parameters and Displayed Results

A vibration measurement meter translates machine motion into numbers that technicians can interpret. In practical inspections, the main choices are acceleration, velocity, and displacement. Acceleration responds well to high-frequency bearing impacts. Velocity often reflects overall machine severity. Displacement is more useful for slow, large movements. Each parameter may appear in metric or imperial units, so check the selected unit before recording results. Small display details matter.

Acceleration Acceleration responds well to high-frequency bearing impacts.
Velocity Velocity often reflects overall machine severity.
Displacement Displacement is more useful for slow, large movements.

Most meters show RMS, peak, or peak-to-peak values. RMS describes typical vibration energy during the sampling period. Peak captures the strongest brief event. Peak-to-peak shows the full movement range between opposite extremes. Frequency, shown in hertz or cycles per minute, helps connect vibration to rotating speed. A spectrum display separates energy by frequency, while a time waveform shows signal changes moment by moment. Crest factor, calculated from peak and RMS values, can reveal sharp impacts that RMS may hide.

RMS RMS describes typical vibration energy during the sampling period.
Peak Peak captures the strongest brief event.
Peak-to-peak Peak-to-peak shows the full movement range between opposite extremes.

Reliable readings require firm sensor contact, a repeatable location, and stable operating conditions. I have seen a normal-looking value change after pressing the sensor at another angle. That mistake is easy to overlook. Temperature, load, mounting stiffness, and nearby equipment can also affect results. A single number should not decide maintenance action. Compare readings with earlier measurements, machine limits, and the actual sound or movement. Still, trend data can mislead when operating conditions are not logged. Record speed, load, sensor position, units, and measurement mode beside every result.

Record speed, load, sensor position, units, and measurement mode beside every result. Still, trend data can mislead when operating conditions are not logged.

Common Applications and Meter Selection Factors

What Is a Vibration Measurement Meter and How Does It Work?

A vibration measurement meter uses a sensor to detect mechanical movement. Most portable meters use an accelerometer attached to a machine housing. The sensor converts movement into an electrical signal. The instrument then calculates acceleration, velocity, displacement, or frequency. RMS velocity is widely used for overall machine severity, while FFT analysis helps identify bearing, imbalance, or gear-mesh problems.

A simple reading can reveal a loose base, worn bearing, or poor alignment before failure becomes obvious.

Common Applications and Meter Selection Factors

Technicians use these meters on motors, pumps, fans, compressors, gearboxes, and rotating production equipment. Route-based checks work well for many facilities. Continuous monitoring suits critical machines with expensive downtime. The U.S. Department of Energy’s Operations & Maintenance Best Practices guide reports that predictive maintenance may reduce maintenance costs by 25–30% and downtime by 35–45%. These figures support vibration checks, but results depend on skills, installation, and follow-up.

Choose a meter by frequency range, sensor mounting method, measurement units, storage capacity, and environmental protection. Magnetic mounting is quick. Stud mounting is usually more repeatable. Check calibration requirements and compatibility with ISO 20816 evaluation practices. High temperature, moisture, and strong electromagnetic noise also matter. A meter with trend recording is often more useful than one with many unused features. Alarm limits should reflect machine type and operating speed. They should not be copied blindly.

A clean reading is not proof of good health. I still compare readings with load, temperature, speed, and operating history. Context matters.

We are proud to support

Registered Company Name: Upminster Containers Limited. Registered Address: Mardyke Works, St Mary's Lane, Upminster, Essex RM14 3PA. Registered Company Number: 00940382
Developed & Maintained By Space Rocket Digital.
chevron-down